MoSPI expands infrastructure performance dashboard to 165 indicators for evidence-based policymaking
Quarterly PAIMANA update adds 44 new indicators across six infrastructure sectors to strengthen monitoring and transparency
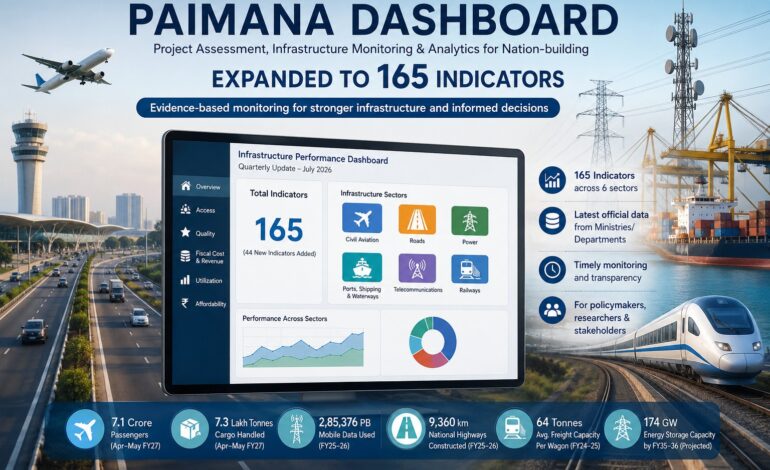
Launched in April this year, the dashboard monitors infrastructure performance across five dimensions - Access, Quality, Fiscal Cost & Revenue, Utilisation, and Affordability - covering six critical sectors: Civil Aviation, Roads, Power, Ports, Shipping & Waterways, Telecommunications, and Railways.

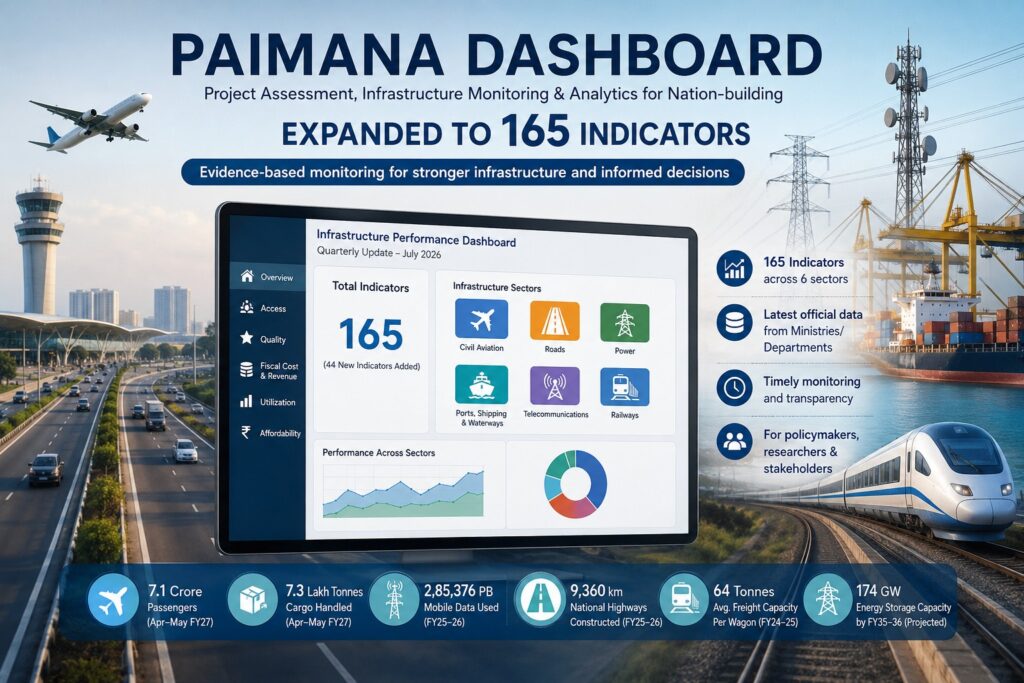
NEW DELHI: The Ministry of Statistics and Programme Implementation (MoSPI) has expanded its infrastructure performance monitoring framework by increasing the number of indicators tracked under its PAIMANA dashboard from 121 to 165, adding 44 new indicators to provide a more comprehensive assessment of key infrastructure sectors and support evidence-based policymaking.
The quarterly update of the Project Assessment, Infrastructure Monitoring & Analytics for Nation-building (PAIMANA) dashboard incorporates the latest official data from ministries and departments, making infrastructure performance statistics available through a unified digital platform for policymakers, researchers and other stakeholders. The dashboard also introduces sector-wise narratives to improve interpretation of infrastructure trends and performance.
Launched in April this year, the dashboard monitors infrastructure performance across five dimensions – Access, Quality, Fiscal Cost & Revenue, Utilisation, and Affordability – covering six critical sectors: Civil Aviation, Roads, Power, Ports, Shipping & Waterways, Telecommunications, and Railways. The latest update tracks 31 indicators for civil aviation, 37 for railways, 62 for ports and waterways, 14 for power, 13 for telecommunications, and eight for roads, taking the total indicator count to 165.
Key infrastructure trends
The dashboard highlights sustained momentum across multiple infrastructure sectors.
In civil aviation, domestic passenger traffic reached 7.1 crore during April-May FY 2026-27, while cargo handled touched 7.3 lakh tonnes, registering 10.6% year-on-year growth. The number of operational aerodromes has increased to 165, reflecting continued expansion of the country’s aviation network.
The telecommunications sector continued its digital expansion, with wireless and mobile data consumption rising to 2,85,376 petabytes during FY 2025-26, up 24.7% year-on-year. The number of telecom subscribers also increased to 133.06 crore, while mobile tower infrastructure expanded to 8.55 lakh towers and 32.25 lakh Base Transceiver Stations (BTSs).
📰 Why is this in the news?
The Ministry of Statistics and Programme Implementation (MoSPI) has released the latest quarterly update of its PAIMANA (Project Assessment, Infrastructure Monitoring & Analytics for Nation-building) Performance Monitoring Dashboard. The dashboard has been significantly expanded by adding 44 new indicators, taking the total number of infrastructure performance indicators to 165, strengthening evidence-based policymaking and transparency in infrastructure governance.
🎯 Key Highlights
- PAIMANA dashboard now tracks 165 infrastructure indicators across six sectors.
- 44 new indicators have been added in the latest quarterly update.
- Monitors infrastructure performance using five dimensions:
- Access
- Quality
- Fiscal Cost & Revenue
- Utilisation
- Affordability
- Provides policymakers, researchers and stakeholders with a unified digital platform for infrastructure analytics.
- Quarterly updates aim to improve transparency, monitoring and evidence-based decision-making.
📊 Sector-wise Indicator Distribution
| Infrastructure Sector | Indicators |
|---|---|
| Ports, Shipping & Waterways | 62 |
| Railways | 37 |
| Civil Aviation | 31 |
| Power | 14 |
| Telecommunications | 13 |
| Roads | 8 |
📈 Major Performance Indicators
- Civil Aviation: Passenger traffic reached 7.1 crore (Apr–May FY27); cargo handling stood at 7.3 lakh tonnes, up 10.6%.
- Telecommunications: Mobile data consumption rose to 2,85,376 PB (24.7% YoY); telecom subscribers increased to 133.06 crore.
- Road Transport: 9,360 km of National Highways were constructed during FY26; electronic toll transactions reached 88 crore.
- Railways: Average freight carrying capacity increased to a record 64 tonnes per wagon; network expanded beyond 1.37 lakh km.
- Ports: Coastal cargo handling increased while inland waterways and maritime logistics continued expanding.
- Power: Energy storage capacity projected to reach 174 GW (94 GW PSP + 80 GW BESS) by FY2035-36.
🏛️ About PAIMANA
| Full Form | Project Assessment, Infrastructure Monitoring & Analytics for Nation-building |
| Launched | 16 April 2026 |
| Developed by | Ministry of Statistics & Programme Implementation (MoSPI) |
| Objective | Evidence-based monitoring of India’s infrastructure sectors through standardized performance indicators. |
🎓 UPSC / Competitive Exam Takeaways
- Know the full form of PAIMANA.
- Remember that the dashboard now tracks 165 indicators.
- Focus on the five monitoring dimensions.
- Understand how data-driven governance supports evidence-based policymaking.
- Relevant for GS-II (Governance), GS-III (Infrastructure), Economy and Digital Governance.
PAIMANA represents India’s shift from infrastructure creation to performance-driven infrastructure governance. By continuously measuring outcomes across transport, power, telecom and logistics, the dashboard enables governments to make faster, data-backed investment and policy decisions while improving accountability.
Road transport maintained steady growth, with 9,360 km of National Highways constructed during FY 2025-26. Digital tolling also gathered pace, with electronic toll collection transactions reaching 88 crore during the first two months of FY 2026-27, indicating wider adoption of cashless mobility.
The railways sector reported improved freight efficiency, with the average carrying capacity of broad-gauge wagons rising to a record 64 tonnes per wagon in 2024-25. The rail network has also expanded to over 1.37 lakh track kilometres, while daily passenger traffic reached nearly 20 million during FY 2024-25.
The ports, shipping and waterways sector registered continued growth, with coastal cargo handling increasing and India’s sea-borne trade nearly doubling over the past decade. Inland waterways infrastructure has also expanded, strengthening multimodal logistics and maritime connectivity.
The power sector projections indicate rapid growth in energy storage capacity, with Pumped Storage Plants (PSPs) and Battery Energy Storage Systems (BESS) expected to reach 94 GW and 80 GW, respectively, by FY 2035-36, supporting higher renewable energy integration and grid reliability.
According to MoSPI, regular quarterly updates of the PAIMANA dashboard will continue to improve transparency, facilitate informed decision-making and strengthen accountability in infrastructure development. The next quarterly update is scheduled for October 16, 2026.