
Centre expands PAIMANA into a data-driven infrastructure command platform
The upgraded system is tracking 1,847 ongoing projects worth ₹40.54 lakh crore, while a 165-indicator dashboard assesses infrastructure performance across six key sectors.
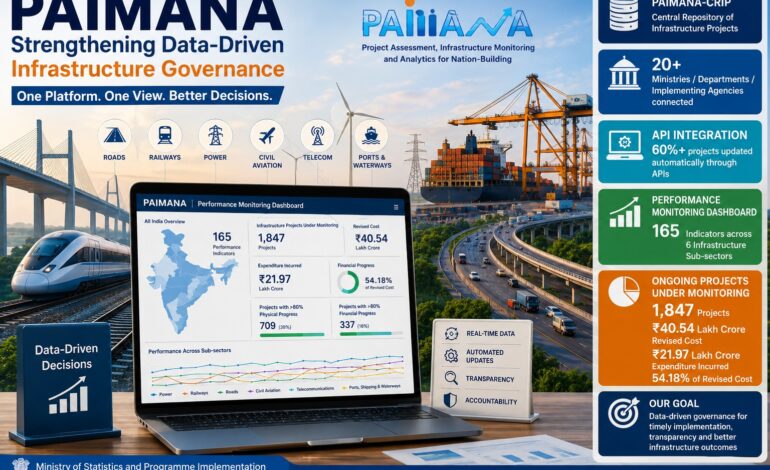
With the launch of PAIMANA-CRIP in July 2026 and a separate Performance Monitoring Dashboard, the system is being positioned as a central repository and analytical platform for India's infrastructure ecosystem.

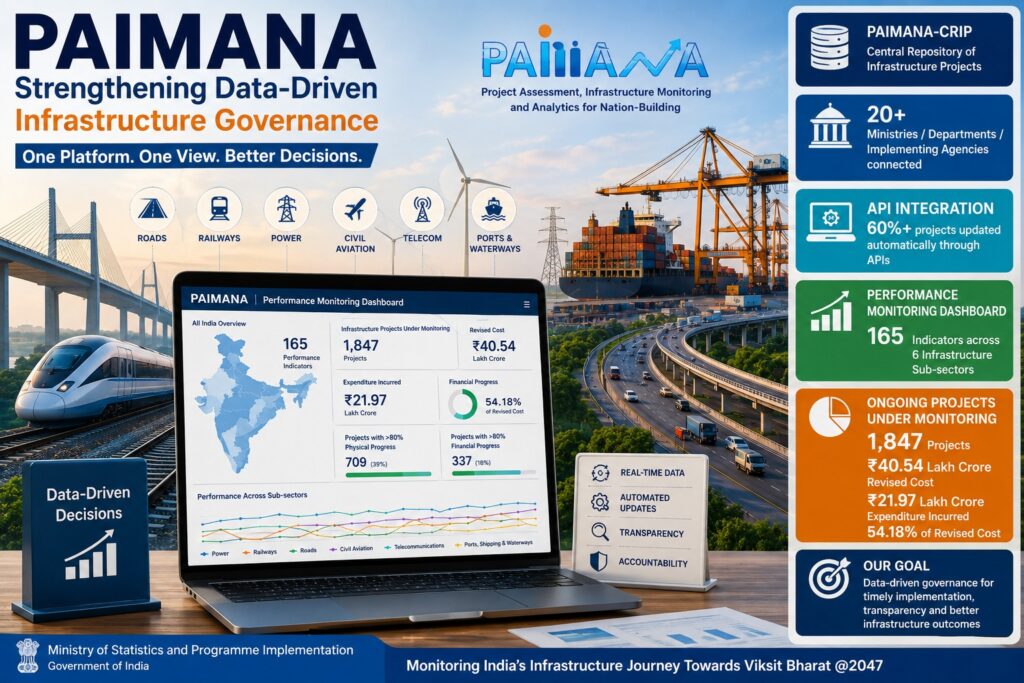
NEW DELHI: India is turning infrastructure monitoring into a more data-driven exercise, with the government expanding PAIMANA into a central digital platform that brings together project monitoring, performance analytics and cross-sector infrastructure data, the Union government has stated.
Developed by the Ministry of Statistics and Programme Implementation (MoSPI), PAIMANA — Project Assessment, Infrastructure Monitoring and Analytics for Nation-Building — was launched on September 25, 2025 to monitor Central Sector infrastructure projects costing ₹150 crore or more.
The platform has now moved beyond simply tracking whether projects are progressing on schedule, the government said in a statement on Monday.
With the launch of PAIMANA-CRIP in July 2026 and a separate Performance Monitoring Dashboard, the system is being positioned as a central repository and analytical platform for India’s infrastructure ecosystem.
The scale of infrastructure being brought under this digital monitoring framework is substantial.
As of June 2026, 1,847 ongoing projects across 17 Central Ministries and Departments were under monitoring, with a combined revised cost of ₹40.54 lakh crore.
Expenditure on these projects had reached ₹21.97 lakh crore, equivalent to about 54.18% of their revised cost. Around 709 projects, or approximately 39%, had crossed 80% physical progress, while about 337 projects had crossed 80% financial completion.
From project monitoring to infrastructure intelligence
PAIMANA replaces the earlier OCMS-2006, the Online Computerized Monitoring System, which had been used for monitoring Central Sector projects.
The latest architecture is considerably broader.
On July 8, 2026, MoSPI launched PAIMANA-CRIP, replacing the DPIIT Integrated Project Monitoring Portal. The new module is envisioned as the Central Repository of Infrastructure Projects.
Data relating to PRAGATI, PMG and other government review mechanisms is subsequently expected to be sourced and updated through the same platform.
More than 20 Ministries, Departments and implementing agencies are regularly updating project information on PAIMANA-CRIP, either through direct data entry or APIs.
The project-monitoring vertical is also integrated through API-based data exchange with DPIIT’s IPMP/IIG. More than 60% of projects on PAIMANA are currently being updated automatically through APIs from the management-information systems or web platforms of respective Ministries and Departments.
That shift from manual reporting to automated data exchange could be one of the most consequential changes in the system.
Instead of waiting for periodic project reports to be compiled and submitted, the monitoring architecture is increasingly designed to draw information directly from the digital systems of implementing agencies.
165 indicators to measure infrastructure performance
The second major component is the Performance Monitoring Dashboard, launched on April 16, 2026.
The dashboard brings together infrastructure performance indicators from official data published or provided by the concerned ministries and departments and presents them through interactive visualisations and analytical tools.
The indicator framework was developed in consultation with the National Institute of Public Finance and Policy and aligned with the Harmonized Master List of Infrastructure, issued by the Department of Economic Affairs.
The framework has now been expanded to 165 indicators, including 54 newly added indicators.
The indicators cover six infrastructure sub-sectors – civil aviation, roads, power, ports, shipping and waterways, telecommunications, and railways.
Ports, shipping and waterways account for the largest number of indicators, with 62.
Railways have 37 indicators and civil aviation 31, while power has 14, telecommunications 13 and roads eight.
The idea is to create a common digital interface through which policymakers, researchers and other stakeholders can examine infrastructure performance sector by sector and over time.
Beyond counting output
The more significant change is in what the government wants to measure.
The revamped monitoring approach moves beyond tracking conventional sectoral outputs such as production.
Instead, infrastructure performance is being assessed through multiple dimensions — access, quality, fiscal cost and revenue, utilisation and affordability.
Access examines how widely infrastructure is available. Quality considers its usefulness and reliability. Fiscal cost and revenue examine the allocation and use of financial resources, while utilisation measures how efficiently infrastructure is being used.
Affordability assesses whether infrastructure services are economically accessible to people.
The government says this categorisation is intended to move infrastructure analysis beyond simple output tracking towards a more holistic assessment, enabling better-informed policy decisions and targeted interventions.
The dashboard also tracks year-on-year, month-on-month and cumulative growth, along with targets and capacity utilisation in selected sectors.
Transport and logistics dominate project pipeline
The project-monitoring data also reveals where the bulk of India’s infrastructure investment is currently concentrated.
The Transport and Logistics sector accounts for 1,341 of the ongoing projects, with a combined value of ₹22.32 lakh crore.
The monitored portfolio includes 769 mega projects costing ₹1,000 crore or more, together worth ₹30.51 lakh crore.
Another 1,078 projects fall into the ₹150 crore to ₹1,000 crore category, with a combined value of ₹5.10 lakh crore.
The Ministry of Road Transport and Highways has the largest number of projects under monitoring, with 1,022 projects accounting for 55% of the project count and a revised cost share of ₹9.89 lakh crore.
The Ministry of Railways is implementing 255 projects with a combined revised cost of ₹8.69 lakh crore, while the Ministry of Coal has 121 projects worth ₹2.22 lakh crore.
Several other Ministries also account for substantial infrastructure investments.
The Ministry of Petroleum and Natural Gas is implementing 105 projects worth ₹4.33 lakh crore, the Ministry of Power has 98 projects worth ₹5.71 lakh crore, and the Ministry of Housing and Urban Affairs has 50 projects worth ₹3.65 lakh crore.
The Department of Water Resources, River Development and Ganga Rejuvenation has 40 projects with a revised cost of ₹2.04 lakh crore.
The monitoring challenge is therefore not simply about tracking thousands of individual projects.
It is about understanding how these projects interact across sectors and whether the massive public investment flowing into roads, railways, power, ports, urban infrastructure and other areas is translating into usable infrastructure.
Data becomes the governance layer
PAIMANA’s growing role is also changing the way ministries and departments interact with infrastructure data.
Concerned ministries and departments receive regular updates on project execution based on analytics generated within the platform. The system is intended to help authorities identify areas where project execution requires attention.
Monthly review meetings and other coordination mechanisms are being supported by performance data, reinforcing an evidence-based monitoring approach.
Every Line Ministry and Department also has login credentials for tailored dashboards, enabling them to directly review project progress.
This effectively places a digital monitoring layer between infrastructure spending and government decision-making.
A project can be assessed not only on whether construction has begun or how much money has been spent, but also on its physical progress, financial progress, sectoral performance, utilisation and broader infrastructure outcomes.
From monitoring delays to identifying patterns
The evolution of PAIMANA reflects a broader change in the government’s approach to infrastructure governance.
Traditional project monitoring largely asks a straightforward question: Is the project progressing?
The new system attempts to ask several additional questions.
Is the infrastructure accessible? Is it being used efficiently? Is it reliable? What does it cost? Is it affordable? How is one infrastructure sector performing relative to another?
That distinction matters in an infrastructure-heavy economy.
A road completed on paper is not necessarily a successful infrastructure outcome if connectivity remains poor. A power asset may exist, but its performance depends on utilisation and reliability. A port’s value ultimately depends not merely on its capacity but on how effectively that capacity is used.
The expanded indicator framework is designed to bring these dimensions into the monitoring process.
A digital backbone for infrastructure governance
PAIMANA-CRIP and the Performance Monitoring Dashboard together represent a shift towards treating infrastructure data as a strategic governance asset.
The former is being developed as a central repository for infrastructure-project information, while the latter provides analytical tools to assess performance across sectors.
The integration of APIs, automated updates and cross-sector dashboards potentially reduces dependence on fragmented reporting systems and allows government agencies to work from a common data environment.
The government’s stated objective is greater transparency, efficiency and accountability in infrastructure development.
But the larger significance may lie in the transition from project monitoring to performance governance.
With ₹40.54 lakh crore of ongoing projects already under watch, the ability to identify delays, assess utilisation, compare sectoral performance and intervene using current data could become increasingly important as India scales up infrastructure investment.
PAIMANA is consequently evolving from a system that watches projects into a platform designed to help the government understand how India’s infrastructure is actually performing.
And that may be the more important transformation: not merely building more infrastructure, but building the data architecture needed to know whether the infrastructure being built is delivering what it was meant to deliver.